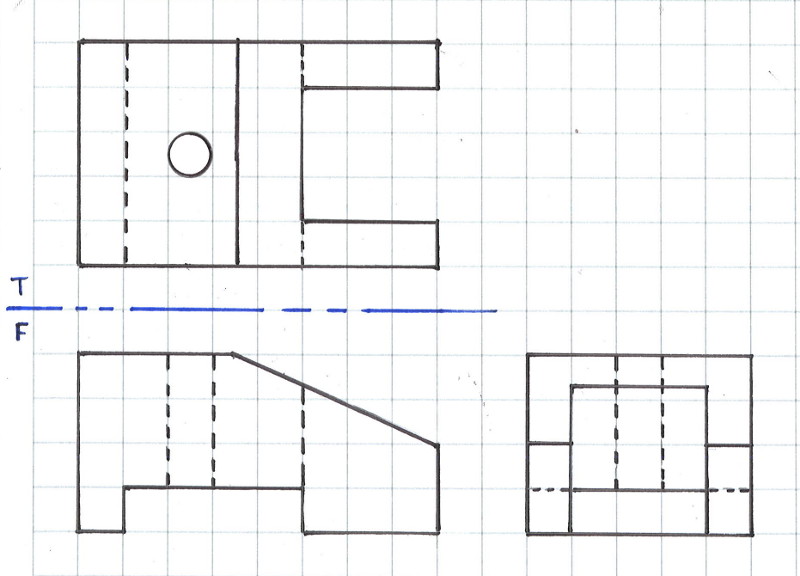
Auxiliary View Example


Graphic visual representations of information, data or knowledge intended to present complex information quickly and clearly

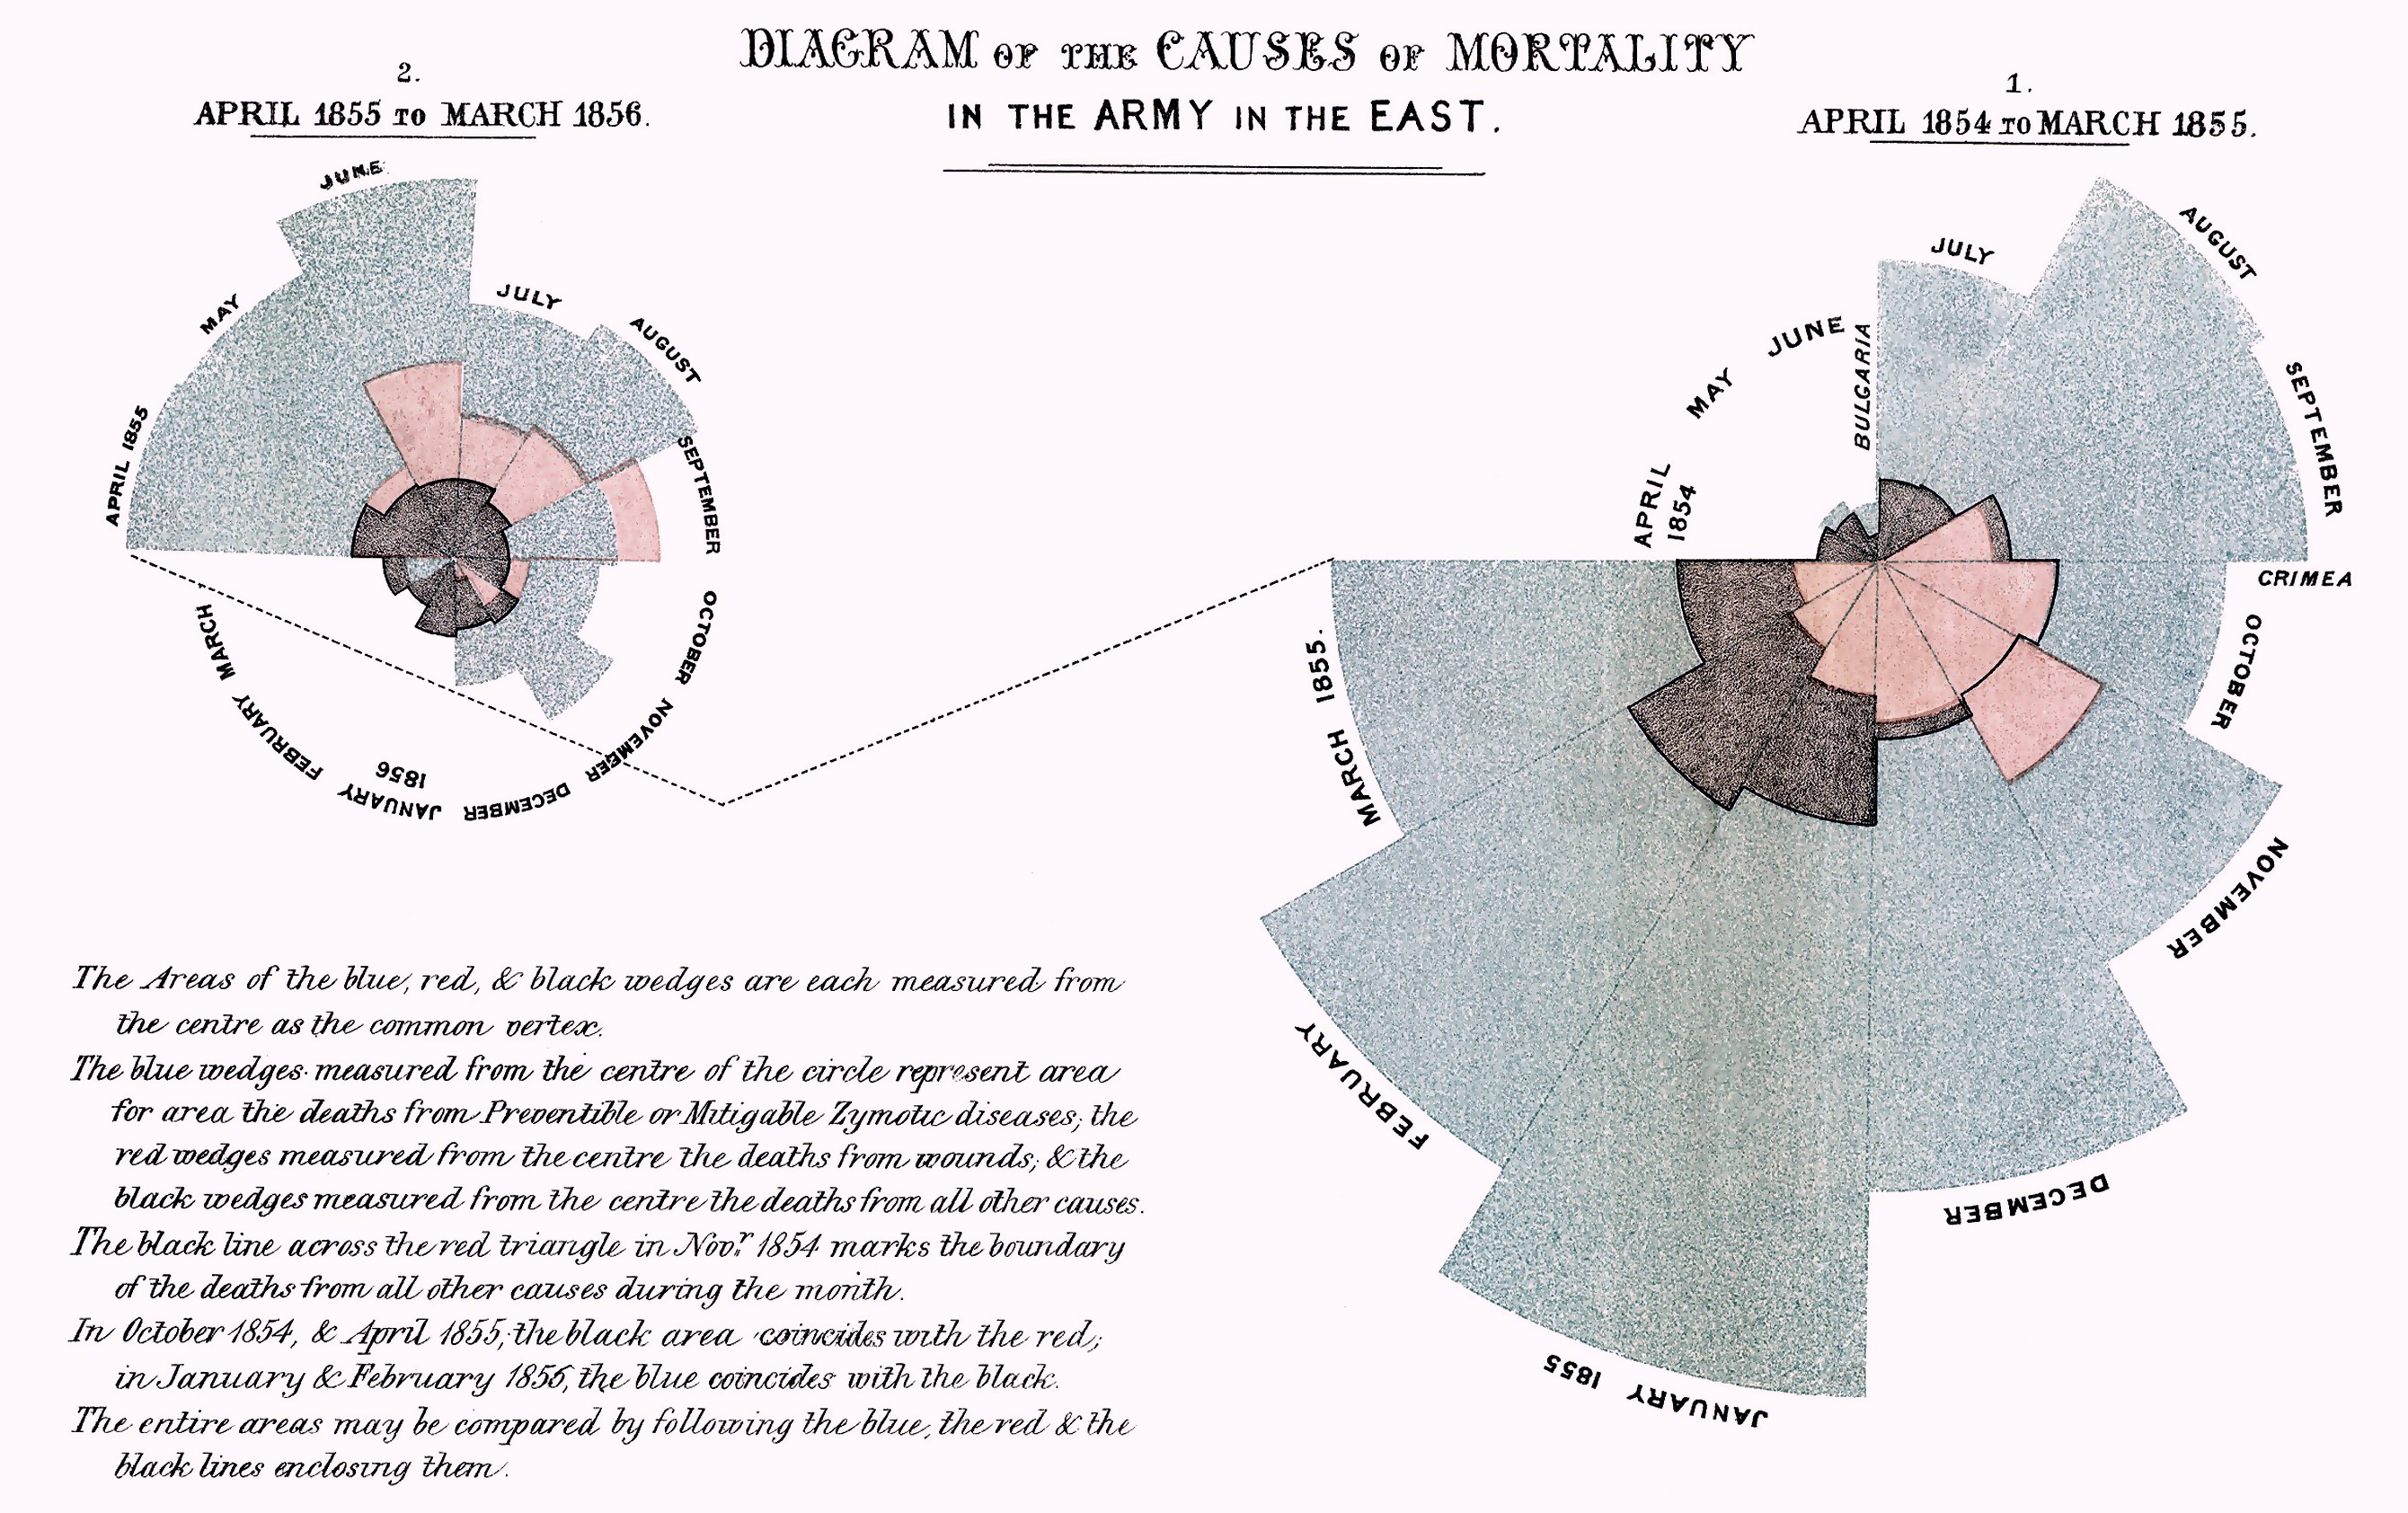

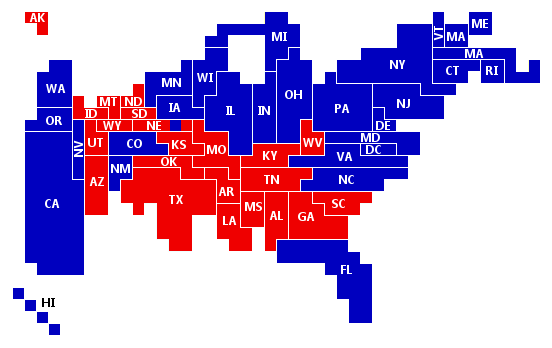
Graphical representation of data in which the data is represented by symbols, such as bars in a bar chart, lines in a line chart, or slices in a pie chart.
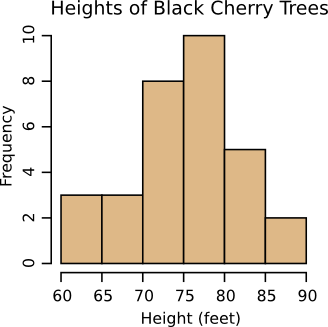
Histogram |

Bar Chart |

Pie Chart |

Line Chart |
A plot is a graphical technique for representing a data set, usually as a graph showing the relationship between two or more variables.
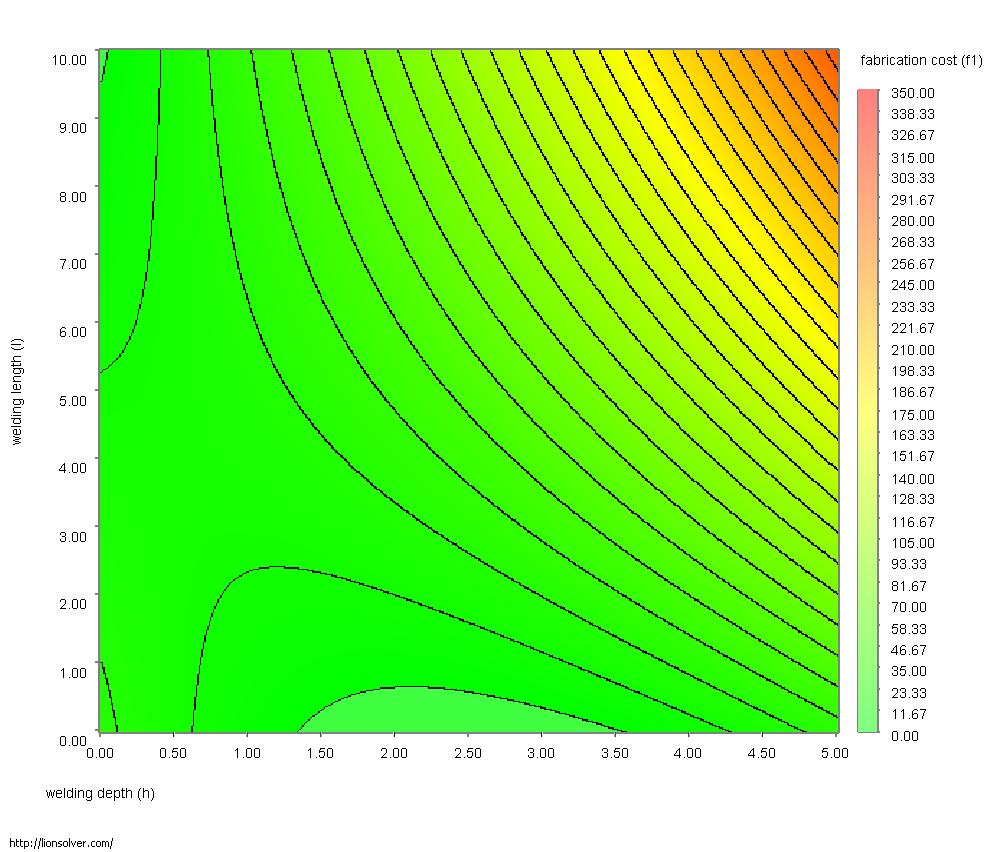
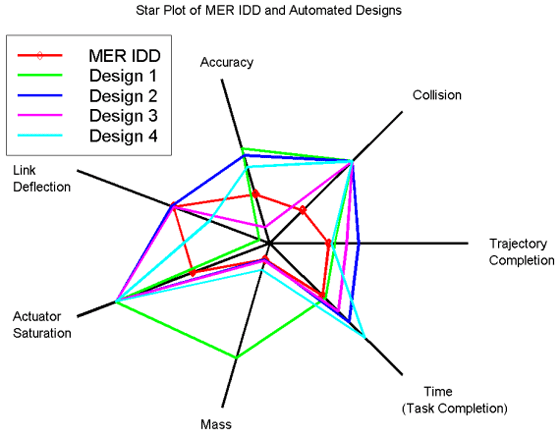
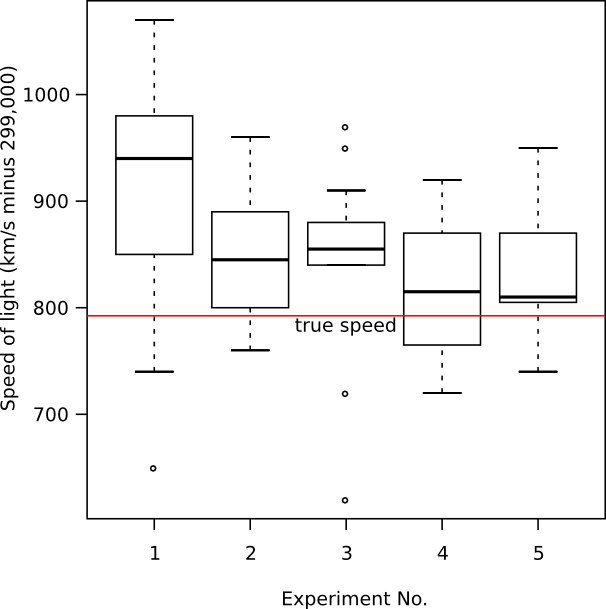
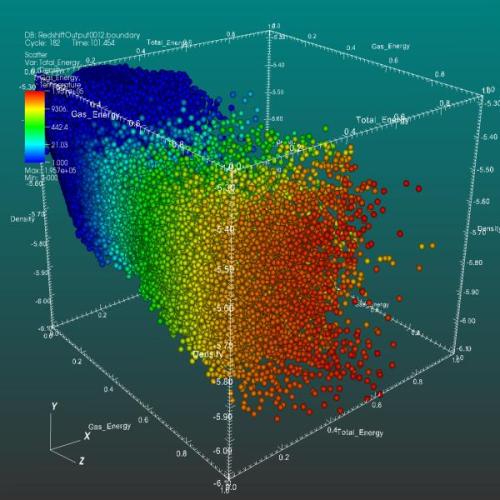

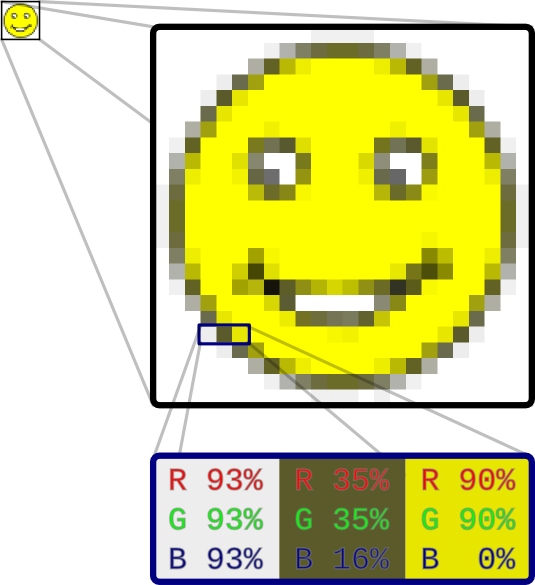
A raster, or bitmap, graphic is a dot matrix data structure representing a generally rectangular grid of pixels, or points of color, viewable via a monitor, paper, or other display medium.
Filetypes: .gif, .png, .jpg, .bmp
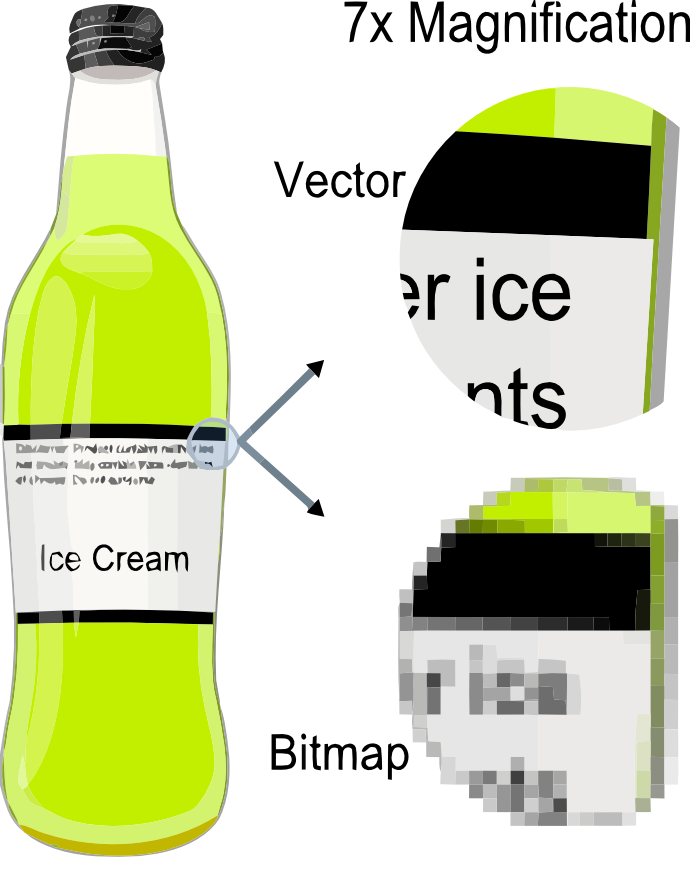
is the use of geometrical primitives such as points, lines, curves, and shapes or polygon(s), which are all based on mathematical expressions, to represent images in computer graphics.
Filetypes: .svg, .ps, .eps, .pdf, (.doc, .odt)
Units are pretty straightforward except for the notation of a pixel. Most units are physical distances in our reality, but a pixel isn't. It can change from display to display. There are some compatibility issues that you should be aware of between printed media and video images for that reason.
The smallest single element of a digital image. The word resolution is often used for the amount of pixels in an image. The higher the resolution the better the ability to reproduce the actual image digitally. A pixel does not equal a standard physical dimension, it depends on the screen the image is being displayed on.
A measure of spatial printing or video dot density, the number of individual dots that can be placed in a line within the span of 1 inch (2.54 cm). Correlates with image resolution, but is related only indirectly (from Wikipedia).
Can describe the resolution, in pixels, of an image to be printed within a specified space. For instance, a 100 x 100 pixel image that is printed in a 1-inch square could be said to have 100 dots per inch (DPI). Good quality photographs usually require 300 dpi. (from Wikipedia)
Modern computer-monitors typically display about 72 to 130 pixels per inch (PPI some modern consumer printers can resolve 2400 dots per inch (DPI) or more
The DPI measurement of a printer often needs to be considerably higher than the pixels per inch (PPI) measurement of a video display in order to produce similar-quality output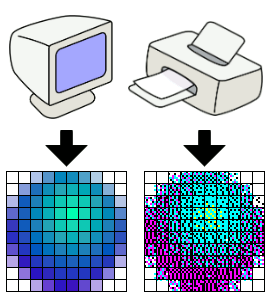
\(\TeX\): Donald Knuth's computer based typesetting system released in 1978
\(\LaTeX\): Leslie Lamport's document markup language and document preparation based on \(\TeX\)
TeX input: $-b \pm \sqrt{b^2 - 4ac} \over 2a$
Tex output: $$-b \pm \sqrt{b^2 - 4ac} \over 2a$$
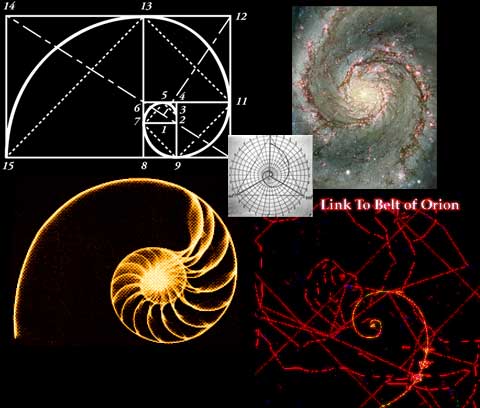
$$\frac{a + b}{a} = \frac{a}{b} = \varphi$$
$$\varphi=\frac{1+\sqrt{5}}{2}=1.618\ldots$$

/
#